

Have you ever stopped at a traffic signal and waited, seemingly endlessly, and no other cars can be seen? Sitting at the red light, wondering why you are not moving when no one else is coming is frustrating and wastes time and energy. There are several possible reasons for this, but the most common is that the signal is not properly timed.
Many municipalities don’t have the on-staff traffic signal expertise necessary to maintain proper signal timings, so the original signal timing remains year after year, without change, regardless of how traffic patterns may have varied. Or worse yet… More time is added to the more congested movements, without adjusting side street timing, in an attempt to improve traffic flow. Though this might seem to work as a short term fix, adjustments of this type will eventually cause longer wait times and vehicle queues as the signal timings are continually adjusted on each street in an attempt to “chase the congestion” and fix the problem. Increased delays, caused by improperly timed traffic signals costs a community both time and money. They decrease the quality of life within that community and in the most severe instances, drive residents, visitors, and businesses away from that community.
Read: What are your Traffic Signals Costing You
Many municipalities don’t realize how a low cost solution such as retiming a traffic signal can reap huge benefits. They worry that no real improvement can be seen without a major investment, so nothing is done, however, if the overall user cost savings are calculated and if the improved air quality was considered, it would be obvious that even a small investment in improved traffic signal timing would save their community money and add to the overall quality of life.
To illustrate these quality of life improvements and show the significant effect signal timing optimization can have on issues such as user costs, vehicular queue lengths and air quality, consider this example project, representative of a situation commonly found throughout upstate New York.
EXAMPLE PROJECT
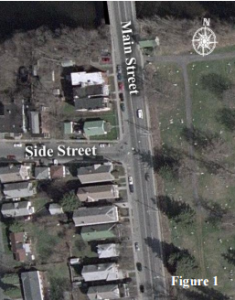
Shown in Figure 1 is a three-legged signalized intersection in an upstate New York municipality. Typical to much of New York State, this intersection once had significant side street traffic (eastbound) because of heavy industrial development to the west, but over the last 20 years much of that development has moved on, leaving a significantly different traffic pattern than when the signal was first installed. Currently, Main Street is a major commuter route that sees significantly more traffic than in the past, yet the Side Street sees traffic that barely warrants a traffic signal.
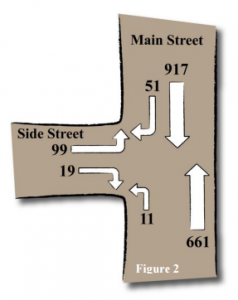
The existing PM peak hour traffic volumes are illustrated in Figure 2 on the next page. Field observations at the site reveal significant back-up “queuing” southbound, which sometimes blocks adjacent signalized intersection located just 500 feet north of this location. This severe queue length and associated delay is a direct result of the signal timings at this intersection, which
was set to cycle through 25 seconds of green time for the Side Street and 25 seconds of green time for Main Street every one minute. This signal is a “fixed time”
signal, meaning it gives that 25 seconds of “green time” to each approach regardless of whether traffic is present or not.
Often, this condition will cause residents to demand high cost lane improvements such as intersection widening to increase capacity, but are those improvements truly needed? Or could simply retiming the signal be enough?
TRAFFIC SIGNAL ANALYSIS
To determine the benefit of retiming the traffic signal, a software program called SYNCHRO 7 is often used. SYNCHRO is a traffic analysis tool that allocates time to each movement base on volume to capacity ratios and the approach delays. This analysis helps balance timings that minimize overall delay and vehicular queues. The delays from SYNCHRO are reported in seconds of delay per vehicle and are categorized by a Level of Service (LOS) grade. These levels of service, which are defined in the “Highway Capacity Manual” published by the Transportation Research Board, range from “A” to “F”, with LOS A being free flowing traffic and LOS F being highly congested conditions with significant delays. Typically, LOS C is desirable and LOS D is minimally
acceptable during peak travel periods.
For this example, only the PM peak hour was reviewed since it is typically the most highly congested hour of the day and will yield a “worst case scenario” analysis. The PM peak hour traffic typically represents about 10% of the daily traffic.
Three options were reviewed as part of the traffic analysis; each represents an action a municipality could take to address the congestion and queuing problem. Table I summarizes the conditions from each: 1. The first option is inaction, the “do-nothing” approach. For many municipalities with no signal operations personnel, this may be the only option they feel they have. 2. The second option is the “add time to the problem” method, where additional green time is added to the road with the congestion problem. This philosophy may work at times, but without reviewing current traffic conditions and adjusting the overall timings to a cycle that properly balances green time versus peak demand, needless time could still be wasted on approaches with few vehicles, causing a less than optimal situation. To simulate this method of improvement for the example project, the Main Street green time was increased by 30 seconds to a total of 55 seconds and the Side Street green time remained at its existing 25 seconds. 3. The final option reviewed was to optimize signal timings for the current traffic conditions. For this alternative, a municipality would need to collect current traffic count information and use traffic engineering techniques to determine the optimal timings for each approach based on volume to capacity needs. As part of this analysis, the minimum cycle length necessary to meet the traffic demand would be determined. This will help reduce queues, keeping them at a minimum. For the example project, the one minute cycle length that exists appeared to be sufficient if green times were properly allocated. Allowing 43 seconds for the Main Street green time and 7 seconds for the Side Street green time, instead of the 25 seconds each seen under existing conditions, yields the best results for this alternative shown in the summary table below.